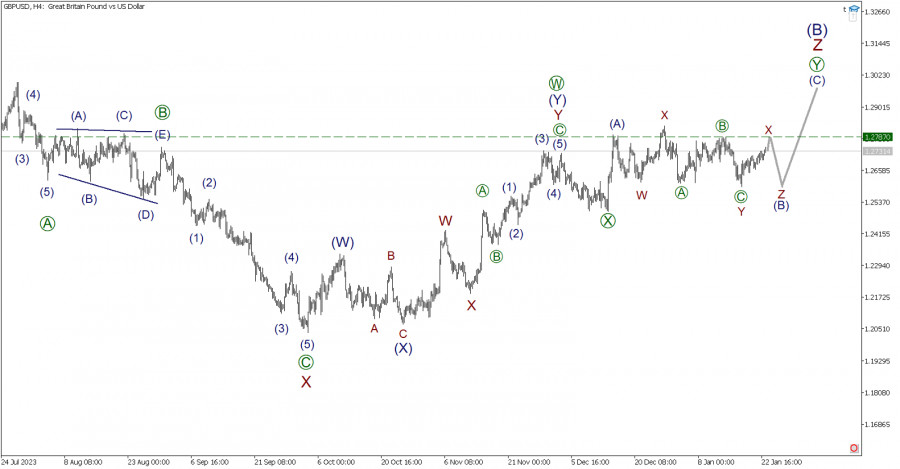

From a wave analysis point of view, an active wave [Y] is forming on the GBP/USD currency pair, which may complete a larger active wave Z. Wave [Y] consists of three parts—sub-waves (A)-(B)-(C). As of writing, the first impulse wave (A) appears to be fully completed, consisting of five sub-waves 1-2-3-4-5.
Following the completion of the impulsive growth, the market began to move horizontally within the correction (B). This correction has the structure of a triple three. In the last segment of the chart, we can observe a rise in the second wave of the X sequence.
The price increase in this wave may rise to the previous high, where the correction [B], part of the active wave Y, was completed. After reaching the level of 1.2787, market participants may expect a fall in the final active wave Z, as shown on the chart.
In the current situation, it is recommended to consider opening long positions.
Trading recommendations: Buy at 1.2731, take profit at 1.2787.
You have already liked this post today
*The market analysis posted here is meant to increase your awareness, but not to give instructions to make a trade.


