আরও দেখুন


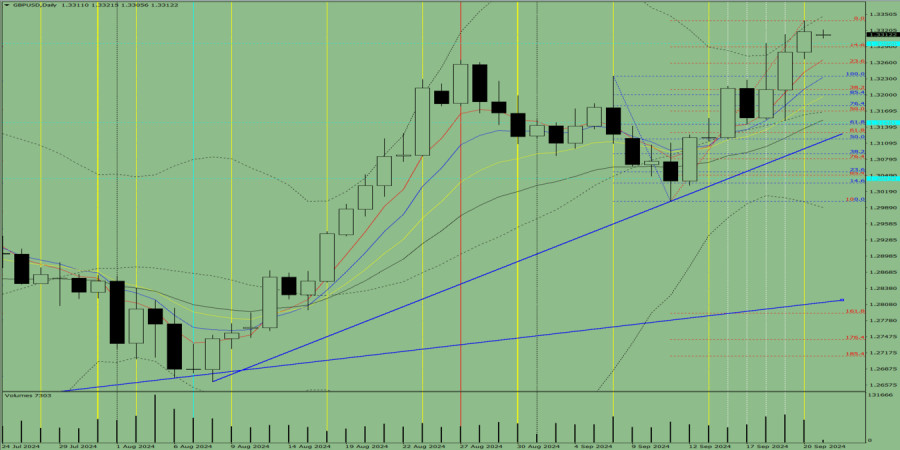
Trend-following analysis (figure 1)
On Monday, the market may try to start moving down from the level of 1.3318 (Friday's daily candle close), targeting 1.3289 – the 14.6% retracement level (red dashed line). From this level, the instrument is likely to continue moving up towards 1.3339 – the upper fractal (red dashed line).
Figure 1 (daily chart)
Complex analysis
Indicator analysis – down
Fibonacci levels – down
Volume – down
Candlestick analysis – down
Trend-following analysis – up
Bollinger bands – down
Weekly chart – down
Conclusion
Today, from the level of 1.3318 (Friday's daily candle close), the price will attempt to start moving down towards 1.3289 – the 14.6% retracement level (red dashed line). From this level, the price will likely continue moving up towards 1.3339 – the upper fractal (red dashed line).
Alternative scenario. From the level of 1.3318 (Friday's daily candle close), the price will attempt to start moving down towards 1.3289 – the 14.6% retracement level (red dashed line). From this level, GBP/USD is likely to continue moving down towards 1.3259 – the 23.6% retracement level (red dashed line).
You have already liked this post today
*এখানে পোস্ট করা মার্কেট বিশ্লেষণ আপনার সচেতনতা বৃদ্ধির জন্য প্রদান করা হয়, ট্রেড করার নির্দেশনা প্রদানের জন্য প্রদান করা হয় না।


