See also


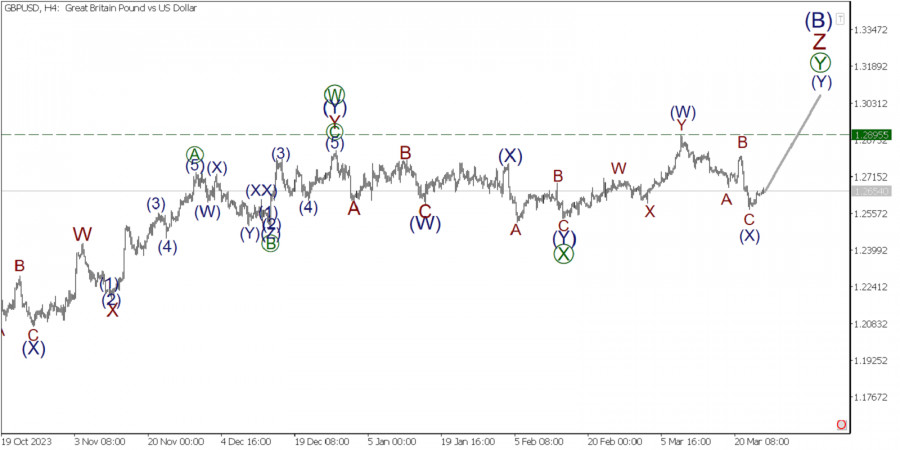
On the four-hour timeframe for the GBP/USD pair, we observe the development of the current wave [Y] of Z, which is the final part of the global correction (B). Most likely, wave [Y], like the previous waves [W]-[X], will take the form of a double zigzag.
Wave [Y] consists of sub-waves (W)-(X)-(Y). The current sub-wave (W) may be completed in the form of a double zigzag W-X-Y. It seems that the corrective wave (X) has also come to an end, taking the form of a standard three-wave zigzag A-B-C.
In the near future, growth is expected in the initial part of the bullish wave (Y). The first target where bulls will push the market is the high of 1.2895. Previously, the current wave (W) was completed at this level. It is difficult to predict what pattern wave (Y) will take, so we continue to monitor the pair.
In the current situation, opening long positions can be considered.
Trading recommendations: Buy at 1.2654, take profit at 1.2895.
You have already liked this post today
*The market analysis posted here is meant to increase your awareness, but not to give instructions to make a trade.


