See also


 15.04.2025 11:59 AM
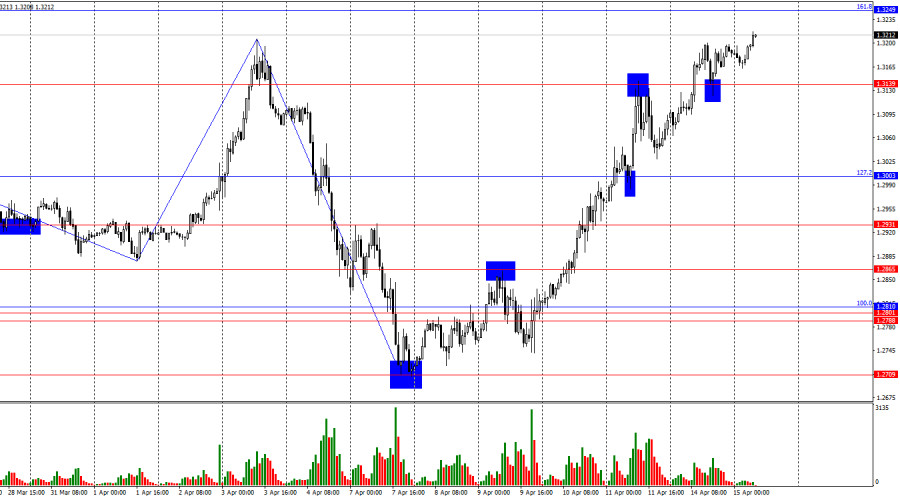
The last completed downward wave broke the previous low, and the new upward wave broke the last peak. As I expected, the "bearish" trend never materialized. Market sentiment remains near panic levels, resulting in frequent movements that make it difficult to interpret the current technical picture clearly. However, Donald Trump and his policies continue to force the bears out of the market.
There was no notable news background on Monday, except for Trump's fresh tariff announcements. These sparked a new bullish wave and another drop in the U.S. dollar. This morning, the UK released reports on unemployment and wages, which traders essentially ignored. First, the market remains fully focused on the trade war. Second, the data was uneventful and uninspiring. The unemployment rate remained unchanged at 4.4%, as expected. Average earnings rose by 5.6%, slightly below forecasts. The number of unemployed increased by 18.7K, just below expectations. Therefore, the pound had room to continue its rise—and did so even without help from the statistics. Over the past five days, sterling has gained 500 pips. As of Tuesday morning, I see no signs of a trend reversal.
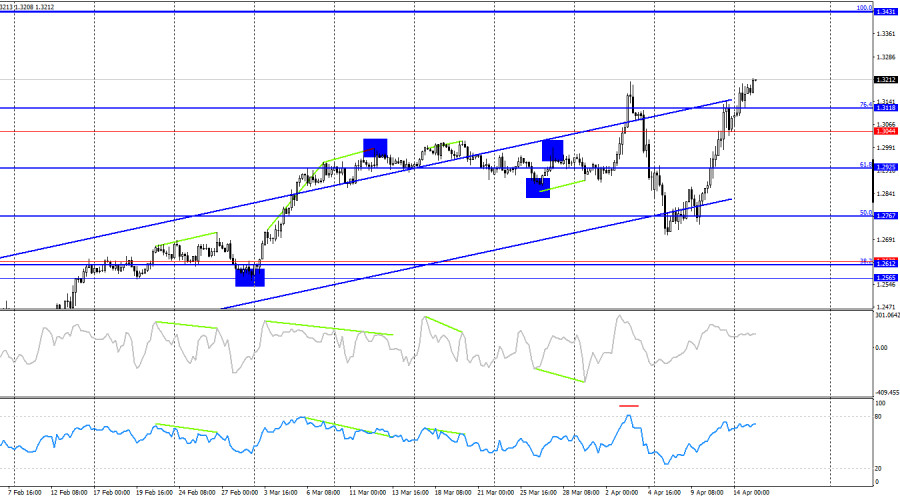
On the 4-hour chart, the pair maintains a bullish trend. A close above the 76.4% Fibonacci level at 1.3118 allows for continued growth toward the 100.0% Fibonacci level at 1.3431. There are no emerging divergences on any indicators. Much still depends on Donald Trump's trade policy. I do not expect a strong rebound in the U.S. dollar in the near term—there are not even any graphical signals suggesting this.
Commitments of Traders (COT) Report:
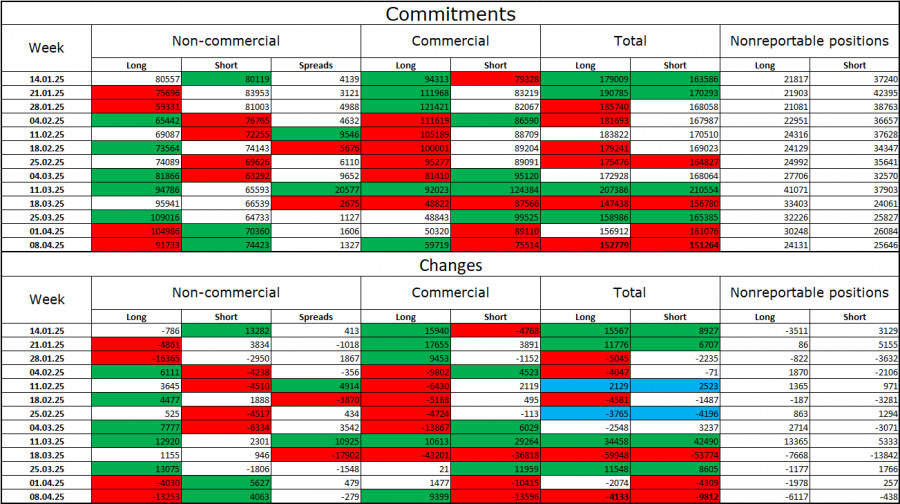
The sentiment among the "Non-commercial" category became less bullish during the last reporting week. The number of long positions held by speculators decreased by 13,253, while short positions increased by 4,067. Bears have lost their edge in the market. The gap between long and short positions now stands at 18,000 in favor of the bulls: 92,000 vs. 74,000.
In my view, the pound still has room for a decline, but recent developments could cause the market to reverse in the longer term. Over the past 3 months, long positions increased from 80,000 to 92,000, while short positions dropped from 80,000 to 74,000. More importantly, over the last 10 weeks, long positions rose from 59,000 to 92,000, and shorts fell from 81,000 to 74,000.
News Calendar for the U.S. and UK:
Tuesday's economic calendar includes three notable releases that have already been published and turned out to be entirely uninteresting. As a result, the impact of the news background on traders' sentiment will likely be absent for the remainder of the day. News related to the trade war will be influential—if any emerges during the day.
GBP/USD Forecast and Trading Tips:
Selling the pair today is possible after a rebound from the 1.3249 level with a target of 1.3139 on the hourly chart. Buying was possible after a close above 1.2810, with targets at 1.2865 and 1.2931—all of which have been reached. Positions could have been held after a close above 1.3003 with a target at 1.3139—this target has also been hit and exceeded. New long positions can be opened with a target of 1.3249 and, beyond that, 1.3357.
Fibonacci levels:
You have already liked this post today
*The market analysis posted here is meant to increase your awareness, but not to give instructions to make a trade.
Useful links: My other articles are available in this section InstaForex course for beginners Popular Analytics Open trading account Important: The begginers in forex trading need to be very careful
From what we see on the 4-hour chart of the Nasdaq 100 index, there are several interesting things, namely, first, the price movement is moving below the MA (100), second
Early in the American session, gold is trading around 3,312 with a bullish bias after breaking out of the symmetrical triangle. Gold is now likely to continue rising
Useful links: My other articles are available in this section InstaForex course for beginners Popular Analytics Open trading account Important: The begginers in forex trading need to be very careful
On the 4-hour chart, the USD/CAD commodity currency pair can be seen moving below the EMA (100) and the appearance of a Bearish 123 pattern and the position
With the Stochastic Oscillator condition heading towards the Oversold level (20) on the 4-hour chart of the AUD/JPY cross currency pair, in the near future AUD/JPY has the potential

Your IP address shows that you are currently located in the USA. If you are a resident of the United States, you are prohibited from using the services of InstaFintech Group including online trading, online transfers, deposit/withdrawal of funds, etc.
If you think you are seeing this message by mistake and your location is not the US, kindly proceed to the website. Otherwise, you must leave the website in order to comply with government restrictions.
Why does your IP address show your location as the USA?
Please confirm whether you are a US resident or not by clicking the relevant button below. If you choose the wrong option, being a US resident, you will not be able to open an account with InstaTrade anyway.
We are sorry for any inconvenience caused by this message.


