See also


 16.04.2025 05:12 AM
Yesterday, the euro zone's ZEW economic sentiment indicators for April were disappointing. The index plunged from 39.8 in March to -18.5, far below the forecast of 13.2. We believe the European business community is taking a more realistic view of the trade war's consequences than the media suggests and is also skeptical about the "off-budget" plan to ramp up defense production. We previously stated that the U.S. will likely be the trade war's main beneficiary. As a result, we view the entire April rise in the euro as speculative and expect a decline once the right catalyst appears.
The first such catalyst could be tomorrow's European Central Bank monetary policy meeting. We anticipate a more decisive stance from the central bank in supporting the economy and responding to slowing inflation. Today's forecast for March CPI is 2.2% y/y versus 2.3% in February. Core CPI is expected to ease from 2.6% y/y to 2.4% y/y.
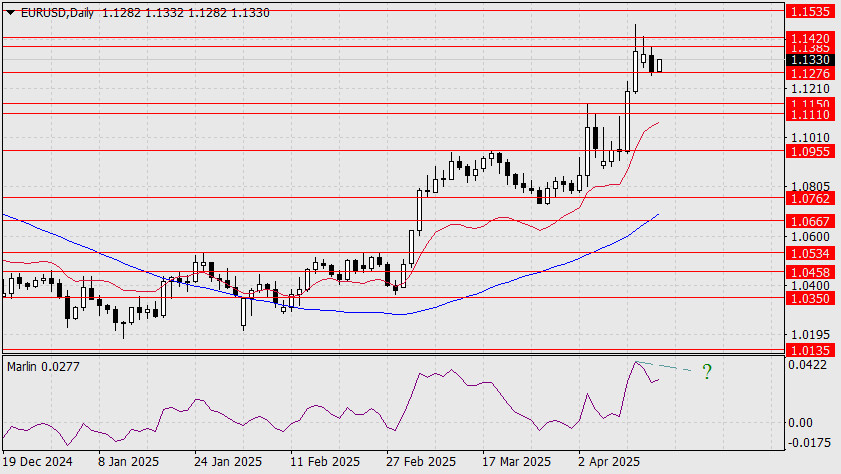
The ideal euro reversal point is the 1.1535 target. If volatility increases on the day of the ECB meeting, this level could be reached, possibly forming a bearish divergence on the daily chart. If there is no upward price spike, a move below the support range at 1.1110/50 would signal a reversal.
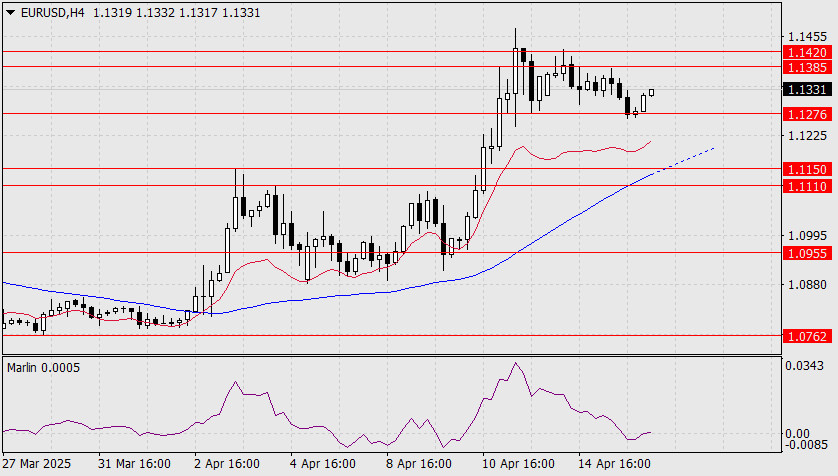
The price is rebounding from the 1.1276 support level on the four-hour chart. The Marlin oscillator is breaking into the positive trend territory, indicating that the upward trend is still intact.
Also on this timeframe, the Kijun (MACD) line has moved into the 1.1110/50 support zone, reinforcing its importance as a potential medium-term reversal area.
You have already liked this post today
*The market analysis posted here is meant to increase your awareness, but not to give instructions to make a trade.
Useful links: My other articles are available in this section InstaForex course for beginners Popular Analytics Open trading account Important: The begginers in forex trading need to be very careful
From what we see on the 4-hour chart of the Nasdaq 100 index, there are several interesting things, namely, first, the price movement is moving below the MA (100), second
Early in the American session, gold is trading around 3,312 with a bullish bias after breaking out of the symmetrical triangle. Gold is now likely to continue rising
Useful links: My other articles are available in this section InstaForex course for beginners Popular Analytics Open trading account Important: The begginers in forex trading need to be very careful
On the 4-hour chart, the USD/CAD commodity currency pair can be seen moving below the EMA (100) and the appearance of a Bearish 123 pattern and the position
With the Stochastic Oscillator condition heading towards the Oversold level (20) on the 4-hour chart of the AUD/JPY cross currency pair, in the near future AUD/JPY has the potential
Forex Chart
Web-version

Your IP address shows that you are currently located in the USA. If you are a resident of the United States, you are prohibited from using the services of InstaFintech Group including online trading, online transfers, deposit/withdrawal of funds, etc.
If you think you are seeing this message by mistake and your location is not the US, kindly proceed to the website. Otherwise, you must leave the website in order to comply with government restrictions.
Why does your IP address show your location as the USA?
Please confirm whether you are a US resident or not by clicking the relevant button below. If you choose the wrong option, being a US resident, you will not be able to open an account with InstaTrade anyway.
We are sorry for any inconvenience caused by this message.


