Voir aussi


 30.11.2023 12:51 PM
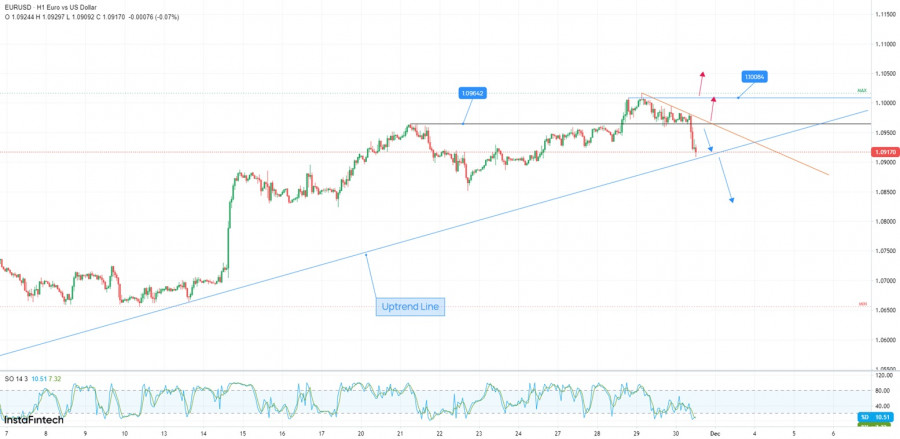
The EUR/USD pair crashed in the short term as the Dollar Index rallied. Now, it is located at 1.0916 and it seems strongly bearish. After its upwards movement, a retreat is natural. Still, a broader correction needs confirmation.
Fundamentally, the Euro took a hit from the Eurozone CPI Flash Estimate indicator which reported only a 2.4% growth versus 2.7% growth estimate, and from the Core CPI Flash Estimate which registered a 3.6% growth versus 3.9% growth expected.
Later, the US is to release high-impact data and should bring strong action. The USD needs more support from the US economy to be able to extend its current appreciation. Unemployment Claims and Core PCE Price Index could report worse data compared to the previous reporting period, while Personal Income and Personal Spending could report a 0.2% growth.
From the technical point of view, the EUR/USD pair registered a false breakout above 1.1008 and now it has turned to the downside.
Now, it is almost to reach the uptrend line which represents a dynamic support. As long as EUR/USD stays above it, the rate could develop a new bullish momentum and could extend its growth. So, the retreat could be only temporary.
Dropping and closing below the uptrend line, retesting this line and staying below the new downtrend line bring us new selling opportunities.
A false breakdown below the uptrend line and making a valid breakout above 1.0964 and above the minor downtrend line activates further growth.
You have already liked this post today
*The market analysis posted here is meant to increase your awareness, but not to give instructions to make a trade.
Tôt dans la session américaine, la paire EUR/USD se négocie autour de 1,1345, atteignant le sommet du canal baissier et montrant des signes d'épuisement. L'euro pourrait reprendre son cycle baissier
D'un autre côté, une faiblesse du métal en dessous du 21SMA à 3 280 pourrait relancer le cycle baissier. Ainsi, on pourrait s'attendre à ce que l'or atteigne
Liens utiles : Mes autres articles sont disponibles dans cette section Cours InstaForex pour débutants Analytique Populaire Ouvrir un compte de trading Important : Les débutants en trading forex doivent
Avec l'apparition du motif Wedge Échoué sur le graphique de 4 heures, cela indique que dans un avenir proche, il a le potentiel d'atteindre le niveau de 3297,43
En observant le graphique de 4 heures de la paire de devises EUR/JPY, il semble que dans un avenir proche, l'EUR/JPY a le potentiel de se renforcer
D'après ce que l'on observe sur le graphique en 4 heures de l'indice Nasdaq 100, l'indicateur Stochastic Oscillator est dans une condition de vente croisée (Crossing SELL) et l'apparition d'un
Le prix du métal jaune pourrait osciller entre 3 203 et atteindre le bas du canal baissier autour de 3 181 dans les prochains jours, un niveau qui coïncide avec
InstaForex en chiffres

Your IP address shows that you are currently located in the USA. If you are a resident of the United States, you are prohibited from using the services of InstaFintech Group including online trading, online transfers, deposit/withdrawal of funds, etc.
If you think you are seeing this message by mistake and your location is not the US, kindly proceed to the website. Otherwise, you must leave the website in order to comply with government restrictions.
Why does your IP address show your location as the USA?
Please confirm whether you are a US resident or not by clicking the relevant button below. If you choose the wrong option, being a US resident, you will not be able to open an account with InstaTrade anyway.
We are sorry for any inconvenience caused by this message.

