Lihat juga


 24.11.2023 08:15 PM
Overview :
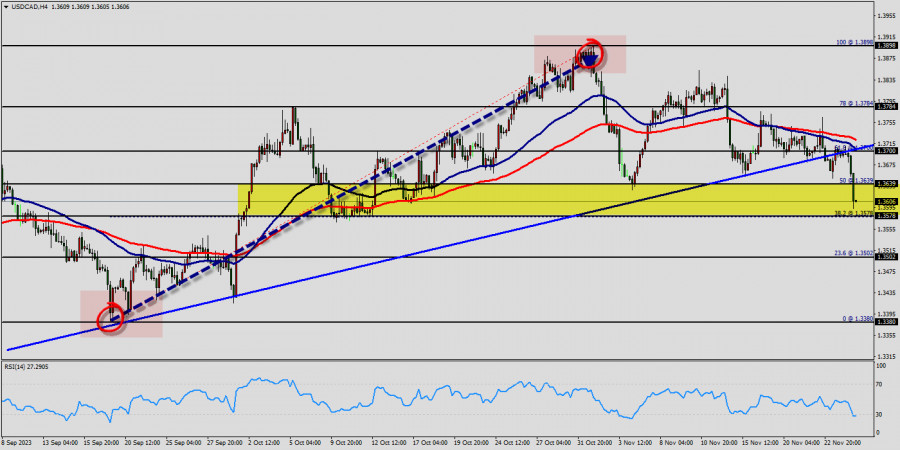
The USD/CAD pair broke resistance which turned to strong support at the level of 1.3578 yesterday. The level of 1.3578 coincides with a golden ratio (38.2% of Fibonacci), which is expected to act as major support today. The Relative Strength Index (RSI) is considered overbought because it is above 30. The RSI is still signaling that the trend is upward as it is still strong above the moving average (100).
The USD/CAD pair is continuing in a bullish market from the support levels of 1.3502 and 1.3578. Also, it should be noted that the current price is in a bullish channel. Equally important, the RSI is still signaling that the trend is upward as it is still strong above the moving average (100) since yesterday.
Immediate support is seen at 1.3578 which coincides with a golden ratio (38.2% of Fibonacci). Consequently, the first support sets at the level of 1.3578. So, the market is likely to show signs of a bullish trend around the spot of 1.3578/1.3502. It is also worth noting that the price at 1.3502 will possibly form a strong support.
This suggests the pair will probably go up in coming hours. Accordingly, the market is likely to show signs of a bullish trend. The level of 1.3784 will act as strong resistance and the double top is already set at the point of 1.3898.
In other words, buy orders are recommended above 1.3578 with the first target at the level of 1.3639. From this point, the pair is likely to begin an ascending movement to the point of 1.3700 and further to the level of 1.3784.
On the other hand, if a breakout happens at the support level of 1.3502, then this scenario may become invalidated.
Forecast :
According to the previous events, the USD/CAD pair is still moving between the levels of 1.3502 and 1.3784; for that we expect a range of 282 pips (1.3784 - 1.3502) in coming days.
If the USD/CAD pair fails to break through the resistance level of 1.3700, the market will decline further to 1.3502. This would suggest a bearish market because the RSI indicator is still in a positive area and does not show any trend-reversal signs. The pair is expected to drop lower towards at least 1.3308 with a view to test the daily pivot point.
You have already liked this post today
*Analisis pasar yang diposting disini dimaksudkan untuk meningkatkan pengetahuan Anda namun tidak untuk memberi instruksi trading.
Dengan munculnya pola Failing Wedge di chart 4 jamnya, memberi petunjuk kalau dalam waktu dekat ini emas berpotensi untuk menuju ke level 3297,43 dan bila momentum serta volatilitasnya mendukung, maka
Dengan melihat chart 4 jam dari pasangan mata uang silang, nampak terlihat dalam waktu dekat ini bahwa EUR/JPY berpotensi untuk menguat, dimana hal ini terkonfirmasi dari munculnya pola Convergence antara
Dari apa yang nampak di chart 4 jamnya pada indeks Nasdaq 100, terlihat indikator Stochastic Oscillator berada dalam kondisi Crossing SELL serta munculnya pola Rising Wedge sehingga berdasarkan dua kondisi
Dengan munculnya Divergent serta pola Descending Broadening Wedge pada chart 4 jam dari pasangan mata uang silang AUD/JPY, meski pergerakan harganya berada dibawah EMA (21) memiliki kemiringan yang menurun, namun
Pada chart 4 jamnya pasangan mata uang utama USD/JPY nampak terlihat kalau indikator Stochastic Oscillator membentuk pola Double Bottom sedangkan pergerakan harga dari USD/JPY membentuk Higher High sehingga Divergent
Pada chart 4 jam dari pasangan mata uang utama USD/JPY, nampak terlihat kalau indikator Stochastic Oscillator membentuk pola Double Bottom sedangkan pergerakan harga dari USD/JPY membentuk Higher High sehingga Divergent
Pada awal sesi Amerika, emas diperdagangkan di sekitar level 3.310, yang terletak di SMA 21 dalam pola triangle simetris yang terbentuk pada 23 April. Konsolidasi kemungkinan akan terbentuk dalam beberapa
Rencana trading kami untuk beberapa jam ke depan adalah menjual di bawah 1.1410 dengan target di 1.1370 dan 1.1230. Indikator eagle memberikan sinyal negatif, jadi kami percaya koreksi teknis dapat
Pada chart 4 jamnya instrumen komoditi Minyak Mentah nampak terlihat bergerak dibawah WMA (21) yang juga memiliki kemiringan slope yang menurun dimana ini berarti saat ini Seller tengah mendominasi
Video pelatihan

Your IP address shows that you are currently located in the USA. If you are a resident of the United States, you are prohibited from using the services of InstaFintech Group including online trading, online transfers, deposit/withdrawal of funds, etc.
If you think you are seeing this message by mistake and your location is not the US, kindly proceed to the website. Otherwise, you must leave the website in order to comply with government restrictions.
Why does your IP address show your location as the USA?
Please confirm whether you are a US resident or not by clicking the relevant button below. If you choose the wrong option, being a US resident, you will not be able to open an account with InstaTrade anyway.
We are sorry for any inconvenience caused by this message.

