Lihat juga


 29.11.2023 05:09 PM
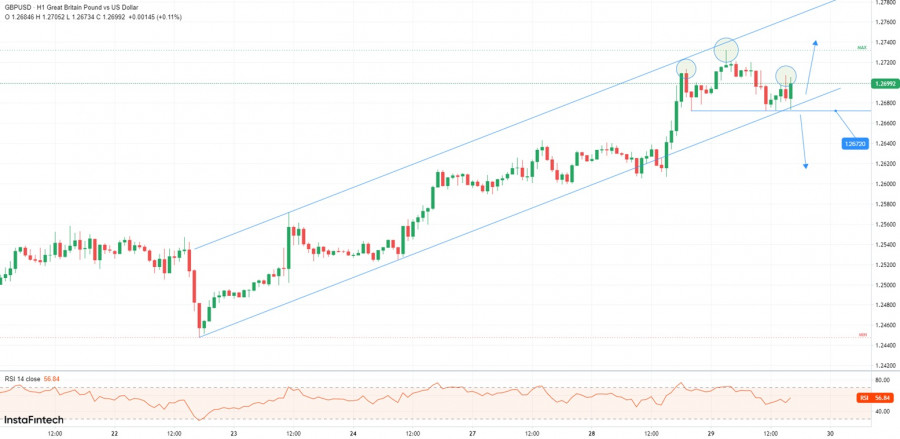
The GBP/USD pair is trading in the green at 1.2700 at the time of writing. It remains to see how it reacts around this psychological level. The bias remains bullish, so further growth could be natural as the Dollar Index remains under deep selling pressure.
Fundamentally, the UK Net Lending to Individuals matched expectations, while Mortgage Approvals and M4 Money Supply reported positive data. On the other hand, the USD could try to take the lead as the US Prelim GDP reported a 5.2% growth versus the 5.0% growth expected, while the Prelim GDP Price Index rose by 3.6% beating the 3.5% growth estimated.
From the technical point of view, the bias is bullish as long as it stays above the uptrend line. It has increased within an up channel but its failure to reach and retest the upside line announced exhausted buyers.
Now, it has developed a potential Head & Shoulders pattern. Still, a downside reversal is far from being confirmed.
As long as it stays above the uptrend line, the GBP/USD pair could resume its growth. New false breakdowns could bring us new longs.
On the other hand, dropping and closing below 1.2672 and under the uptrend line is seen as a selling opportunity. This scenario activates the bearish pattern.
You have already liked this post today
*Analisis pasar yang diposting disini dimaksudkan untuk meningkatkan pengetahuan Anda namun tidak untuk memberi instruksi trading.
Dengan pergerakan harga yang membentuk Higher Low - Lower Low serta didukung oleh kemiringan WMA (30 Shift 2) yang menurun serta pergerakan harga Minyak Mentah yang bergerak dibawahnya, maka jelas
Pada chart 4 jamnya, pasangan mata uang silang GBP/AUD nampak terlihat masih didominasi oleh para Sellers dimana hal ini terkonfirmasi oleh pergerakan harganya yang bergerak dibawah WMA (30 Shift 2)
Pada awal sesi Amerika, pasangan EUR/USD diperdagangkan di sekitar 1,1345, mencapai puncak channel tren menurun dan menunjukkan tanda-tanda kelelahan. Euro dapat melanjutkan siklus bearish-nya jika berkonsolidasi di bawah 1,1370 dalam
Pada awal sesi AS, emas diperdagangkan sekitar 3.322 dengan pergerakan naik yang kuat. Grafik H4 menunjukkan bahwa emas sedang menembus saluran tren bearish. Jika XAU/USD terus naik dalam beberapa
Pada hari Jumat, pasangan EUR/USD naik ke level 1.1374, memantul, dan berbalik mendukung dolar AS. Para penjual kembali menyerang, tetapi hanya sebentar, dan secara keseluruhan mereka tetap cukup lemah. Dengan
Pada grafik per jam, pasangan GBP/USD melanjutkan penurunannya pada hari Jumat menuju level koreksi Fibonacci 161,8% di 1,3249. Pemantulan dari level ini akan menguntungkan pound Inggris dan dapat menyebabkan beberapa
Dengan munculnya pola Failing Wedge di chart 4 jamnya, memberi petunjuk kalau dalam waktu dekat ini emas berpotensi untuk menuju ke level 3297,43 dan bila momentum serta volatilitasnya mendukung, maka
Dengan melihat chart 4 jam dari pasangan mata uang silang, nampak terlihat dalam waktu dekat ini bahwa EUR/JPY berpotensi untuk menguat, dimana hal ini terkonfirmasi dari munculnya pola Convergence antara
Dari apa yang nampak di chart 4 jamnya pada indeks Nasdaq 100, terlihat indikator Stochastic Oscillator berada dalam kondisi Crossing SELL serta munculnya pola Rising Wedge sehingga berdasarkan dua kondisi
InstaTrade dalam angka

Your IP address shows that you are currently located in the USA. If you are a resident of the United States, you are prohibited from using the services of InstaFintech Group including online trading, online transfers, deposit/withdrawal of funds, etc.
If you think you are seeing this message by mistake and your location is not the US, kindly proceed to the website. Otherwise, you must leave the website in order to comply with government restrictions.
Why does your IP address show your location as the USA?
Please confirm whether you are a US resident or not by clicking the relevant button below. If you choose the wrong option, being a US resident, you will not be able to open an account with InstaTrade anyway.
We are sorry for any inconvenience caused by this message.

