Lihat juga


 02.04.2025 03:18 PM
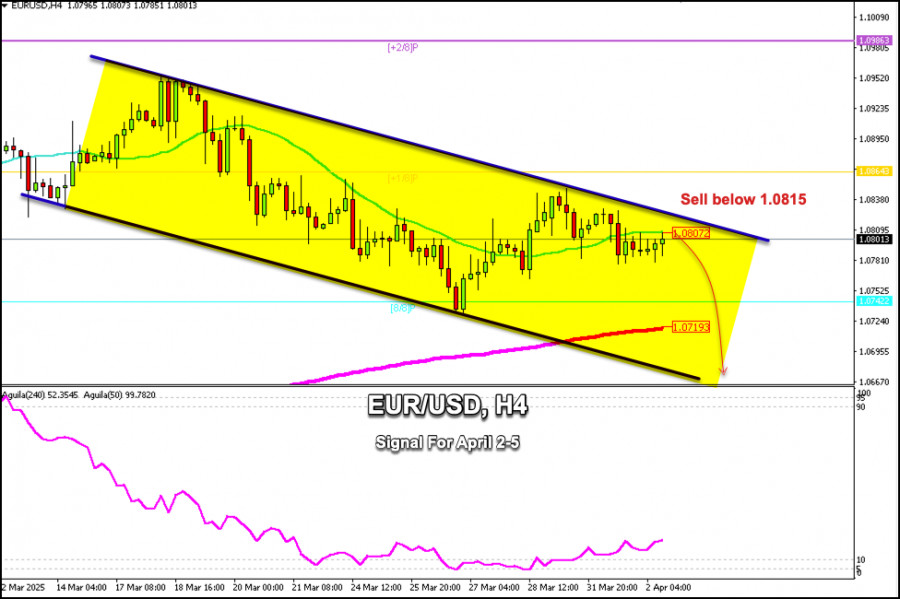
Early in the American session, the EUR/USD pair is trading around 1.0807, below the 21-month SMA, and below the +1/8 Murray level, showing signs of exhaustion.
On the H4 chart, we can see that the euro is trading within the bearish trend channel formed on March 12th and is likely to continue falling in the coming hours if EUR/USD consolidates below 1.0815.
If the euro breaks and consolidates above the bearish trend channel, we could expect it to reach +1/8 Murray level at 1.0864 in the coming days. EUR/USD could even reach +2/8 Murray level located at 1.0986.
On the other hand, with a rejection below 1.0815, the instrument could resume its bearish cycle, and we could expect the euro to reach the 8/8 Murray at 1.0742, the 200 EMA around 1.0719, and finally reach the bottom of the downtrend channel around 1.0670.
According to the chart, the euro is reaching oversold levels. Hence, a resumption of the bullish cycle is expected. However, there is strong pressure below 1.0830, so we believe that if the euro recovers, we should expect a recovery above 1.0864. Then, EUR/USD could climb to the psychological level of 1.10.
Our trading plan for the coming hours is to sell the euro below 1.0815 with a target at 1.0670.
You have already liked this post today
*Analisis pasar yang diposting disini dimaksudkan untuk meningkatkan pengetahuan Anda namun tidak untuk memberi instruksi trading.
Dengan pergerakan harga yang membentuk Higher Low - Lower Low serta didukung oleh kemiringan slope WMA (30 Shift 2) yang menurun serta pergerakan harga Minyak Mentah yang bergerak dibawahnya maka
Pada chart 4 jamnya pasangan mata uang silang GBP/AUD nampak terlihat masih didominasi oleh para Sellers dimana hal ini terkonfirmasi oleh pergerakan harganya yang bergerak dibawah WMA (30 Shift 2)
Pada awal sesi Amerika, pasangan EUR/USD diperdagangkan di sekitar 1,1345, mencapai puncak channel tren menurun dan menunjukkan tanda-tanda kelelahan. Euro dapat melanjutkan siklus bearish-nya jika berkonsolidasi di bawah 1,1370 dalam
Pada awal sesi AS, emas diperdagangkan sekitar 3.322 dengan pergerakan naik yang kuat. Grafik H4 menunjukkan bahwa emas sedang menembus saluran tren bearish. Jika XAU/USD terus naik dalam beberapa
Pada hari Jumat, pasangan EUR/USD naik ke level 1.1374, memantul, dan berbalik mendukung dolar AS. Para penjual kembali menyerang, tetapi hanya sebentar, dan secara keseluruhan mereka tetap cukup lemah. Dengan
Pada grafik per jam, pasangan GBP/USD melanjutkan penurunannya pada hari Jumat menuju level koreksi Fibonacci 161,8% di 1,3249. Pemantulan dari level ini akan menguntungkan pound Inggris dan dapat menyebabkan beberapa
Dengan munculnya pola Failing Wedge di chart 4 jamnya, memberi petunjuk kalau dalam waktu dekat ini emas berpotensi untuk menuju ke level 3297,43 dan bila momentum serta volatilitasnya mendukung, maka
Dengan melihat chart 4 jam dari pasangan mata uang silang, nampak terlihat dalam waktu dekat ini bahwa EUR/JPY berpotensi untuk menguat, dimana hal ini terkonfirmasi dari munculnya pola Convergence antara
Dari apa yang nampak di chart 4 jamnya pada indeks Nasdaq 100, terlihat indikator Stochastic Oscillator berada dalam kondisi Crossing SELL serta munculnya pola Rising Wedge sehingga berdasarkan dua kondisi
Your IP address shows that you are currently located in the USA. If you are a resident of the United States, you are prohibited from using the services of InstaFintech Group including online trading, online transfers, deposit/withdrawal of funds, etc.
If you think you are seeing this message by mistake and your location is not the US, kindly proceed to the website. Otherwise, you must leave the website in order to comply with government restrictions.
Why does your IP address show your location as the USA?
Please confirm whether you are a US resident or not by clicking the relevant button below. If you choose the wrong option, being a US resident, you will not be able to open an account with InstaTrade anyway.
We are sorry for any inconvenience caused by this message.

