Actual patterns

Patterns are graphical models which are formed in the chart by the price. According to one of the technical analysis postulates, history (price movement) repeats itself. It means that the price movements are often similar in the same situations which makes it possible to predict the further development of the situation with a high probability.
Relevant patterns by InstaTrade is an easy-to-use service which allows you to be aware of latest changes in the market and react to clues from the market in time. In our service you will always find the latest and most relevant patterns on any pair and any timeframe.
Actual Patterns
- All
- All
- Bearish Rectangle
- Bearish Symmetrical Triangle
- Bearish Symmetrical Triangle
- Bullish Rectangle
- Double Top
- Double Top
- Triple Bottom
- Triple Bottom
- Triple Top
- Triple Top
- All
- All
- Buy
- Sale
- All
- 1
- 2
- 3
- 4
- 5
Bullish Rectangle
was formed on 28.04 at 10:27:29 (UTC+0)
signal strength 1 of 5
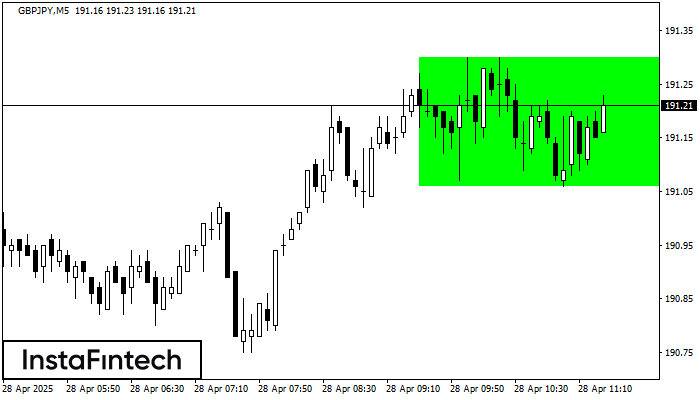
According to the chart of M5, GBPJPY formed the Bullish Rectangle. This type of a pattern indicates a trend continuation. It consists of two levels: resistance 191.30 and support 191.06
The M5 and M15 time frames may have more false entry points.
Open chart in a new window
Bearish pennant
was formed on 28.04 at 10:25:46 (UTC+0)
signal strength 1 of 5
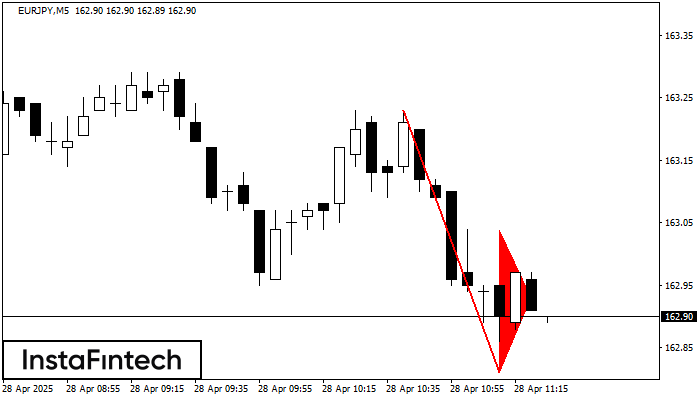
The Bearish pennant pattern has formed on the EURJPY M5 chart. This pattern type is characterized by a slight slowdown after which the price will move in the direction
The M5 and M15 time frames may have more false entry points.
Open chart in a new window
Double Top
was formed on 28.04 at 09:40:28 (UTC+0)
signal strength 1 of 5
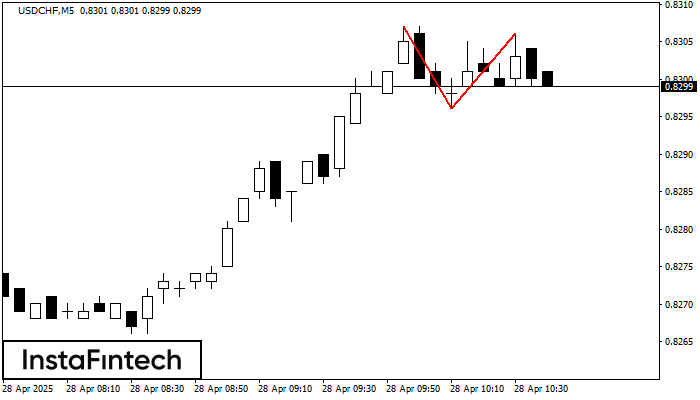
The Double Top reversal pattern has been formed on USDCHF M5. Characteristics: the upper boundary 0.8307; the lower boundary 0.8296; the width of the pattern is 10 points. Sell trades
The M5 and M15 time frames may have more false entry points.
Open chart in a new window
Double Top
was formed on 28.04 at 09:05:43 (UTC+0)
signal strength 1 of 5
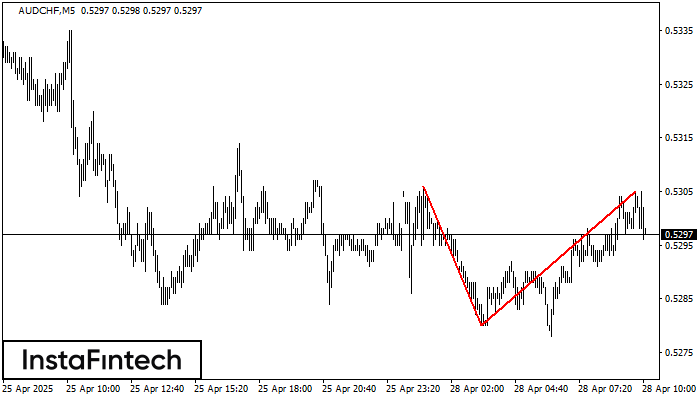
On the chart of AUDCHF M5 the Double Top reversal pattern has been formed. Characteristics: the upper boundary 0.5305; the lower boundary 0.5280; the width of the pattern 25 points
The M5 and M15 time frames may have more false entry points.
Open chart in a new window
Bearish Rectangle
was formed on 28.04 at 09:00:17 (UTC+0)
signal strength 3 of 5
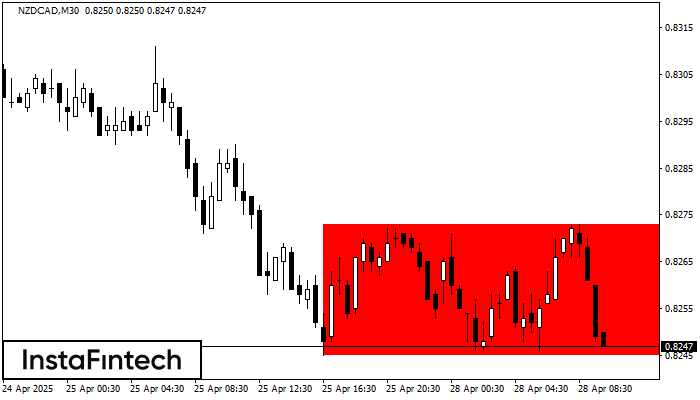
According to the chart of M30, NZDCAD formed the Bearish Rectangle. The pattern indicates a trend continuation. The upper border is 0.8273, the lower border is 0.8245. The signal means
Open chart in a new window
Double Bottom
was formed on 28.04 at 08:30:12 (UTC+0)
signal strength 3 of 5
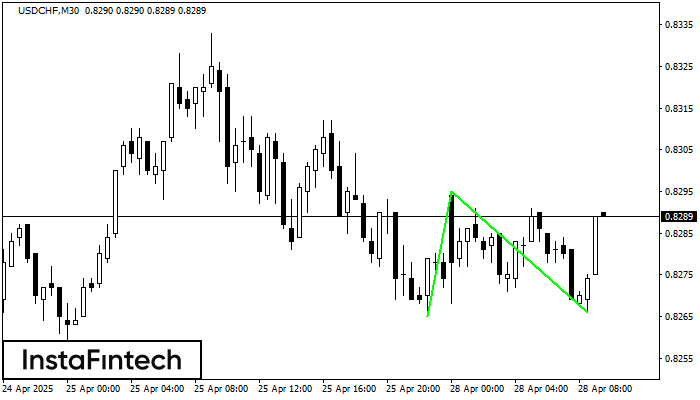
The Double Bottom pattern has been formed on USDCHF M30. This formation signals a reversal of the trend from downwards to upwards. The signal is that a buy trade should
Open chart in a new window
Double Bottom
was formed on 28.04 at 08:00:12 (UTC+0)
signal strength 4 of 5
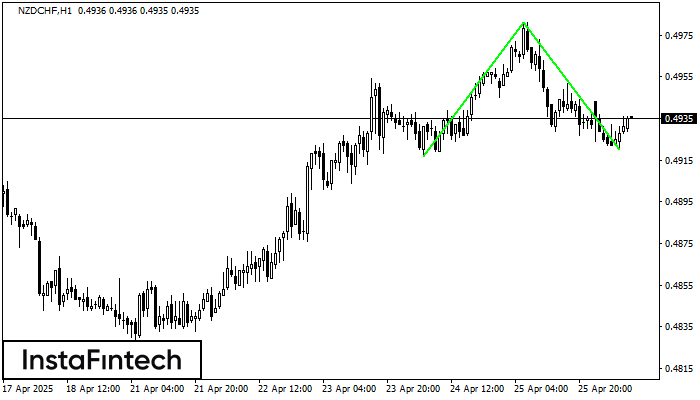
The Double Bottom pattern has been formed on NZDCHF H1. Characteristics: the support level 0.4917; the resistance level 0.4981; the width of the pattern 64 points. If the resistance level
Open chart in a new window
Double Top
was formed on 28.04 at 07:50:42 (UTC+0)
signal strength 1 of 5
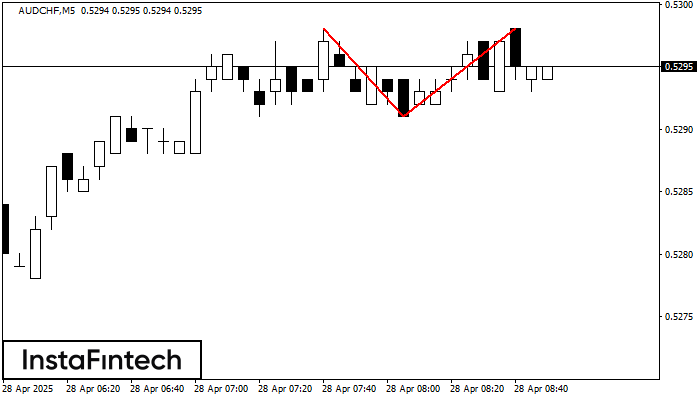
The Double Top pattern has been formed on AUDCHF M5. It signals that the trend has been changed from upwards to downwards. Probably, if the base of the pattern 0.5291
The M5 and M15 time frames may have more false entry points.
Open chart in a new window
Bullish Flag
was formed on 28.04 at 07:39:50 (UTC+0)
signal strength 1 of 5
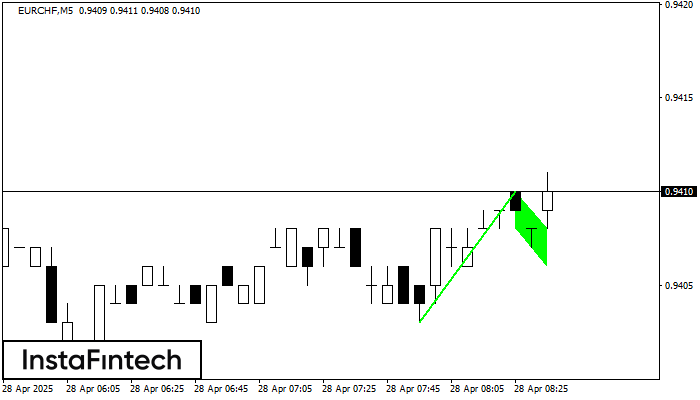
The Bullish Flag pattern has been formed on the chart EURCHF M5 which signals that the upward trend will continue. Signals: а break of the peak at 0.9410 may push
The M5 and M15 time frames may have more false entry points.
Open chart in a new window