Actual patterns

Patterns are graphical models which are formed in the chart by the price. According to one of the technical analysis postulates, history (price movement) repeats itself. It means that the price movements are often similar in the same situations which makes it possible to predict the further development of the situation with a high probability.
Relevant patterns by InstaTrade is an easy-to-use service which allows you to be aware of latest changes in the market and react to clues from the market in time. In our service you will always find the latest and most relevant patterns on any pair and any timeframe.
Actual Patterns
- All
- All
- Bearish Rectangle
- Bearish Symmetrical Triangle
- Bearish Symmetrical Triangle
- Bullish Rectangle
- Double Top
- Double Top
- Triple Bottom
- Triple Bottom
- Triple Top
- Triple Top
- All
- All
- Buy
- Sale
- All
- 1
- 2
- 3
- 4
- 5
Double Bottom
was formed on 08.04 at 13:15:21 (UTC+0)
signal strength 2 of 5
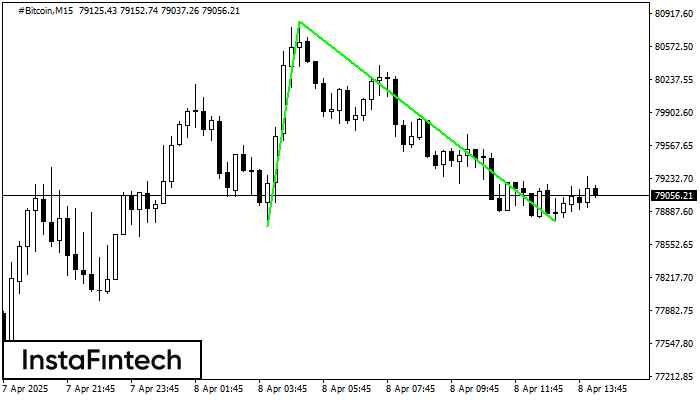
The Double Bottom pattern has been formed on #Bitcoin M15. Characteristics: the support level 78737.33; the resistance level 80832.24; the width of the pattern 209491 points. If the resistance level
The M5 and M15 time frames may have more false entry points.
Open chart in a new window
Double Top
was formed on 08.04 at 13:15:17 (UTC+0)
signal strength 1 of 5
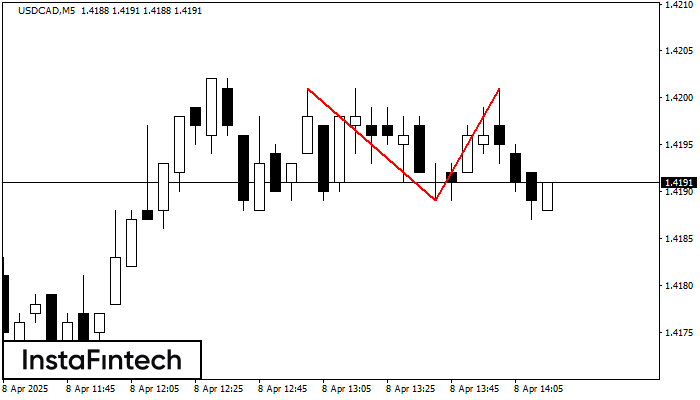
The Double Top reversal pattern has been formed on USDCAD M5. Characteristics: the upper boundary 1.4201; the lower boundary 1.4189; the width of the pattern is 12 points. Sell trades
The M5 and M15 time frames may have more false entry points.
Open chart in a new window
Double Bottom
was formed on 08.04 at 13:10:13 (UTC+0)
signal strength 1 of 5
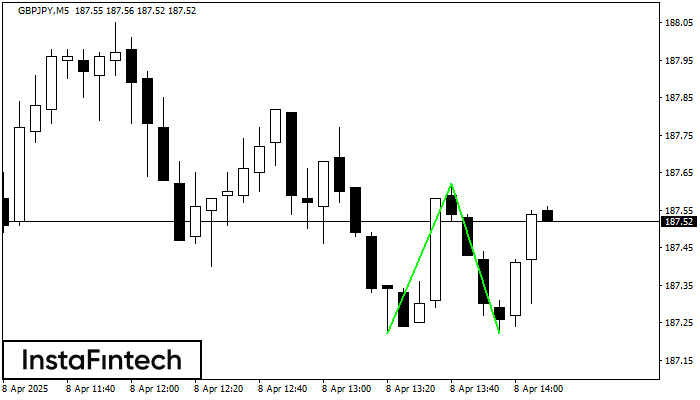
The Double Bottom pattern has been formed on GBPJPY M5. This formation signals a reversal of the trend from downwards to upwards. The signal is that a buy trade should
The M5 and M15 time frames may have more false entry points.
Open chart in a new window
Bearish Symmetrical Triangle
was formed on 08.04 at 13:00:16 (UTC+0)
signal strength 4 of 5
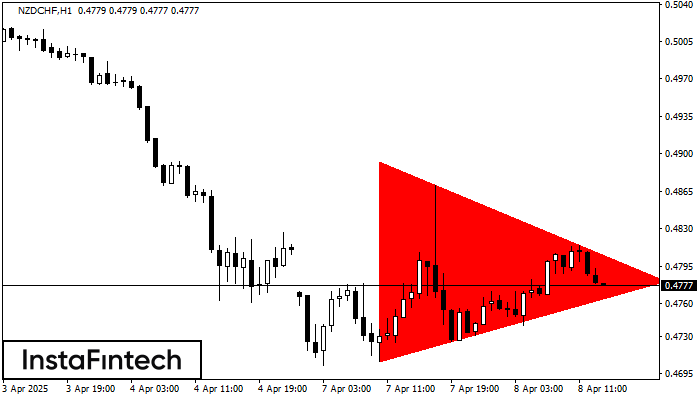
According to the chart of H1, NZDCHF formed the Bearish Symmetrical Triangle pattern. This pattern signals a further downward trend in case the lower border 0.4706 is breached. Here
Open chart in a new window
Bullish Rectangle
was formed on 08.04 at 12:56:16 (UTC+0)
signal strength 1 of 5
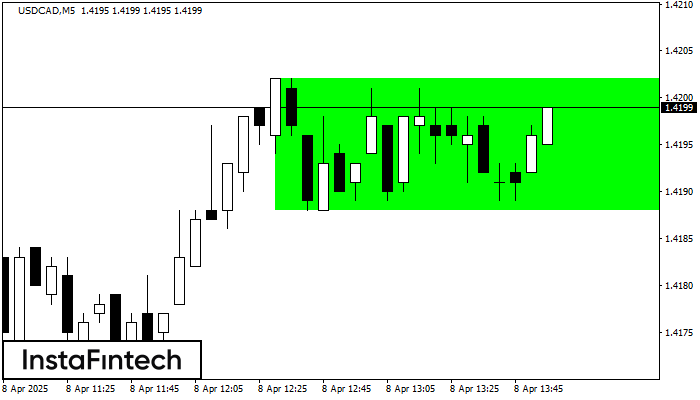
According to the chart of M5, USDCAD formed the Bullish Rectangle which is a pattern of a trend continuation. The pattern is contained within the following borders: the lower border
The M5 and M15 time frames may have more false entry points.
Open chart in a new window
Bearish pennant
was formed on 08.04 at 12:50:05 (UTC+0)
signal strength 2 of 5
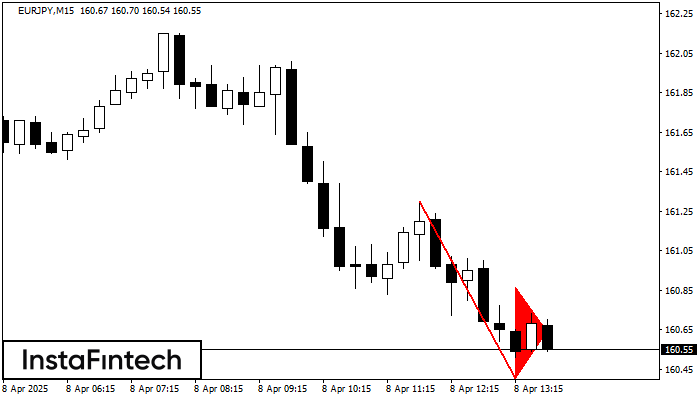
The Bearish pennant pattern has formed on the EURJPY M15 chart. It signals potential continuation of the existing trend. Specifications: the pattern’s bottom has the coordinate of 160.40; the projection
The M5 and M15 time frames may have more false entry points.
Open chart in a new window
Bearish Symmetrical Triangle
was formed on 08.04 at 12:30:45 (UTC+0)
signal strength 4 of 5
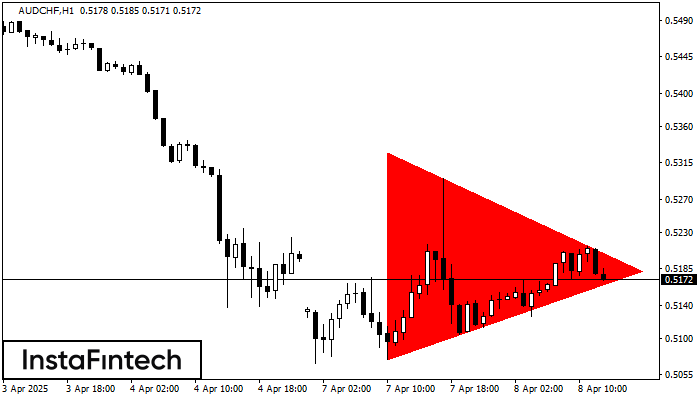
According to the chart of H1, AUDCHF formed the Bearish Symmetrical Triangle pattern. Description: The lower border is 0.5074/0.5182 and upper border is 0.5328/0.5182. The pattern width is measured
Open chart in a new window
Double Bottom
was formed on 08.04 at 12:25:36 (UTC+0)
signal strength 1 of 5
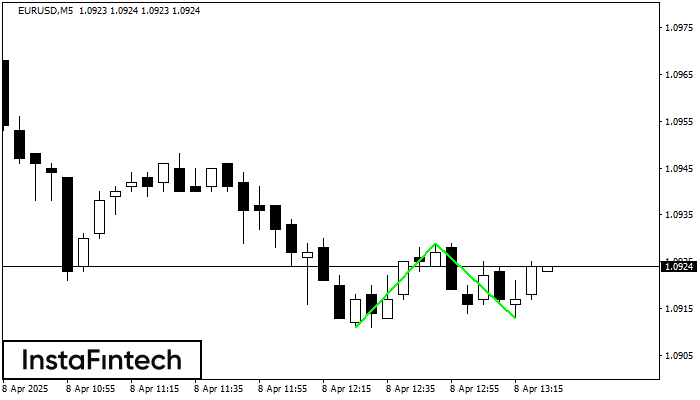
The Double Bottom pattern has been formed on EURUSD M5. Characteristics: the support level 1.0911; the resistance level 1.0929; the width of the pattern 18 points. If the resistance level
The M5 and M15 time frames may have more false entry points.
Open chart in a new window
Double Bottom
was formed on 08.04 at 12:25:16 (UTC+0)
signal strength 1 of 5
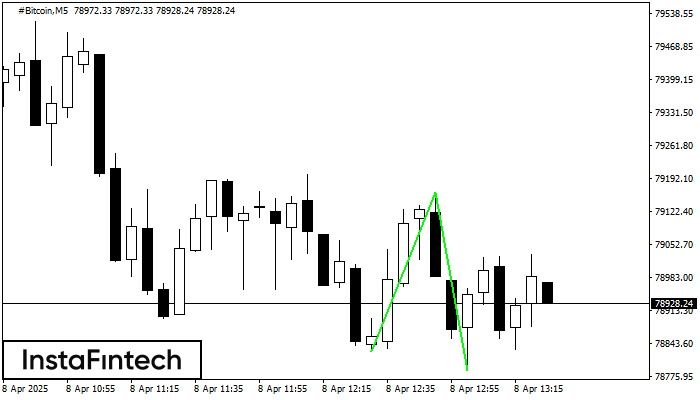
The Double Bottom pattern has been formed on #Bitcoin M5. This formation signals a reversal of the trend from downwards to upwards. The signal is that a buy trade should
The M5 and M15 time frames may have more false entry points.
Open chart in a new window