Veja também


 27.11.2023 09:25 PM
Overview :
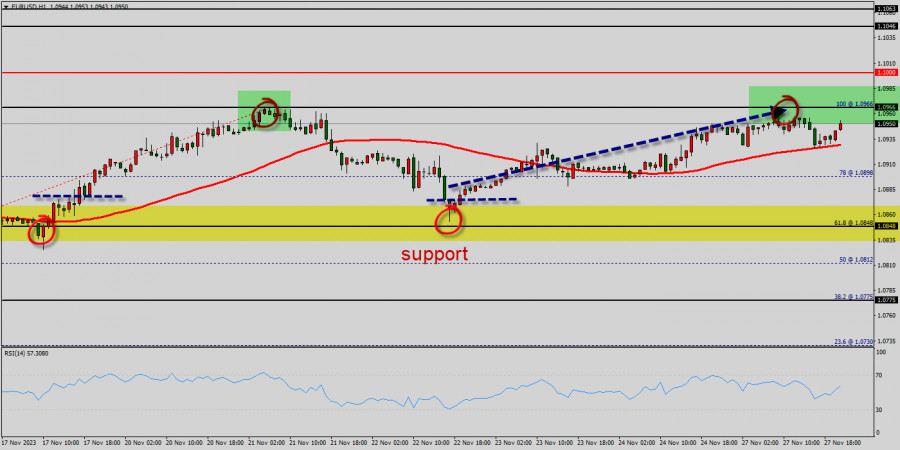
The trend of EUR/USD pair movement was controversial as it took place in a narrow sideways channel, the market showed signs of instability. Amid the previous events, the price is still moving between the levels of 1.0848 and 1.0966. Also, the daily resistance and support are seen at the levels of 1.0966 and 1.0848 respectively.
Therefore, it is recommended to be cautious while placing orders in this area. So, we need to wait until the sideways channel has completed. Last week, the market moved from its bottom at 1.0848 and continued to rise towards the top of 1.0966. Today, in the one-hour chart, the current rise will remain within a framework of correction.
The Relative Strength Index (RSI) is considered overbought because it is below 60. The RSI is still signaling that the trend is downward, but it is still strong above the moving average (100). This suggests the pair will probably go down in coming hours. Accordingly, the market is likely to show signs of a bearish trend.
However, if the pair fails to pass through the level of 1.0966, the market will indicate a bearish opportunity below the strong resistance level of 1.0966 (the level of 1.0966 coincides with the double top too). Since there is nothing new in this market, it is not bullish yet. Sell deals are recommended below the level of 1.0966 with the first target at 1.0848.
If the trend breaks the support level of 1.0848, the pair is likely to move downwards continuing the development of a bearish trend to the level 1.0725 in order to test the daily support 2 (horizontal balck line).
You have already liked this post today
*A análise de mercado aqui postada destina-se a aumentar o seu conhecimento, mas não dar instruções para fazer uma negociação.
Ao analisar o gráfico de 4 horas do par EUR/JPY, observa-se um potencial de fortalecimento no curto prazo. Esse cenário é corroborado pela formação de um padrão de convergência entre
Na sexta-feira, o par EUR/USD subiu para o nível 1,1374, se recuperou e reverteu a favor do dólar americano. Os ursos atacaram novamente, mas apenas brevemente, e, em geral, permaneceram
No gráfico de 4 horas do índice Nasdaq 100, o Oscilador Estocástico apresenta sinal de venda por cruzamento, enquanto se forma um padrão de cunha ascendente — uma configuração geralmente
No início da sessão americana, o par EUR/USD está sendo negociado próximo de 1,1378, dentro de um canal de tendência de baixa formado em 17 de abril, e começa
No início da sessão americana, o ouro está sendo negociado próximo a 3.384, acima do suporte principal e se recuperando após atingir 3.267. A expectativa é que o ouro recupere
Com o surgimento dos padrões de Divergência e de Cunha Descendente Ampliada no gráfico de 4 horas do par AUD/JPY, ainda que o movimento de preços esteja abaixo da Média
No gráfico de 4 horas do par USD/JPY, observa-se que o indicador Oscilador Estocástico forma um padrão de Fundo Duplo, enquanto a ação do preço apresenta uma máxima mais alta
No início da sessão americana, o ouro está sendo negociado próximo do nível de US$ 3.310, região onde se encontra a média móvel simples de 21 períodos (SMA 21)
Clube InstaForex

Your IP address shows that you are currently located in the USA. If you are a resident of the United States, you are prohibited from using the services of InstaFintech Group including online trading, online transfers, deposit/withdrawal of funds, etc.
If you think you are seeing this message by mistake and your location is not the US, kindly proceed to the website. Otherwise, you must leave the website in order to comply with government restrictions.
Why does your IP address show your location as the USA?
Please confirm whether you are a US resident or not by clicking the relevant button below. If you choose the wrong option, being a US resident, you will not be able to open an account with InstaTrade anyway.
We are sorry for any inconvenience caused by this message.

