Padrões atuais

Padrões são modelos gráficos que são formados no gráfico pelo preço. Segundo um dos postulados da análise técnica, a história (movimento de preços) se repete. Isso significa que os movimentos de preços geralmente são semelhantes nas mesmas situações, o que possibilita prever o desenvolvimento futuro da situação com alta probabilidade.
Os padrões relevantes da InstaTrade são um serviço fácil de usar, que permite que você esteja ciente das últimas mudanças no mercado e reaja a indícios do mercado a tempo. Em nosso serviço, você sempre encontrará os padrões mais recentes e relevantes em qualquer par e em qualquer período gráfico.
Double Bottom
was formed on 08.04 at 20:30:25 (UTC+0)
signal strength 1 of 5
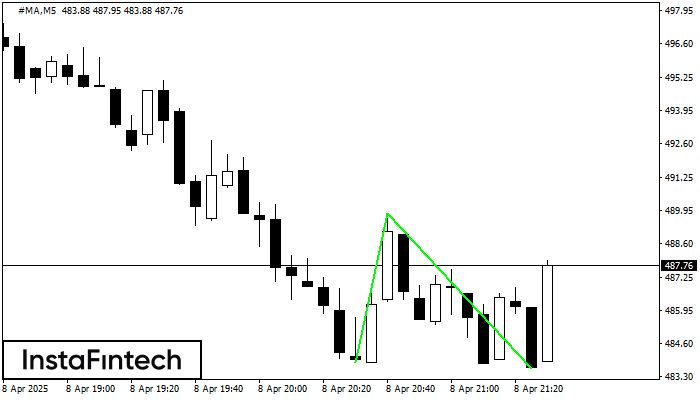
The Double Bottom pattern has been formed on #MA M5; the upper boundary is 489.81; the lower boundary is 483.61. The width of the pattern is 594 points. In case of a break of the upper boundary 489.81, a change in the trend can be predicted where the width of the pattern will coincide with the distance to a possible take profit level.
The M5 and M15 time frames may have more false entry points.
- All
- All
- Bearish Rectangle
- Bearish Symmetrical Triangle
- Bearish Symmetrical Triangle
- Bullish Rectangle
- Double Top
- Double Top
- Triple Bottom
- Triple Bottom
- Triple Top
- Triple Top
- All
- All
- Buy
- Sale
- All
- 1
- 2
- 3
- 4
- 5
Topo duplo
was formed on 30.04 at 17:55:22 (UTC+0)
signal strength 1 of 5
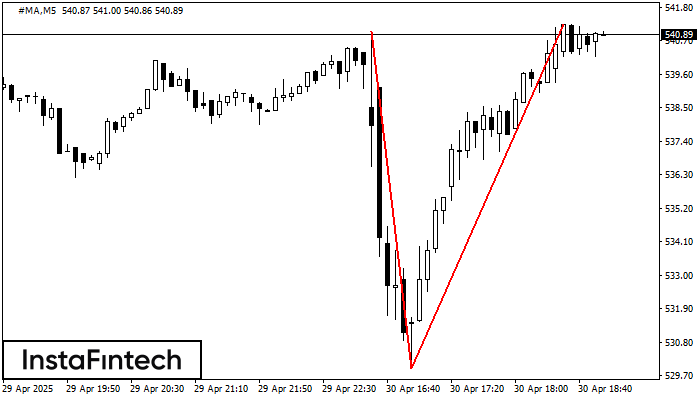
No gráfico de #MA M5 o padrão de reversão Topo duplo foi formado. Características: o limite superior 541.24; o limite inferior 529.93; a largura do padrão 1131 pontos. O sinal
Os intervalos M5 e M15 podem ter mais pontos de entrada falsos.
Open chart in a new window
Pennant de baixa
was formed on 30.04 at 16:35:46 (UTC+0)
signal strength 2 of 5
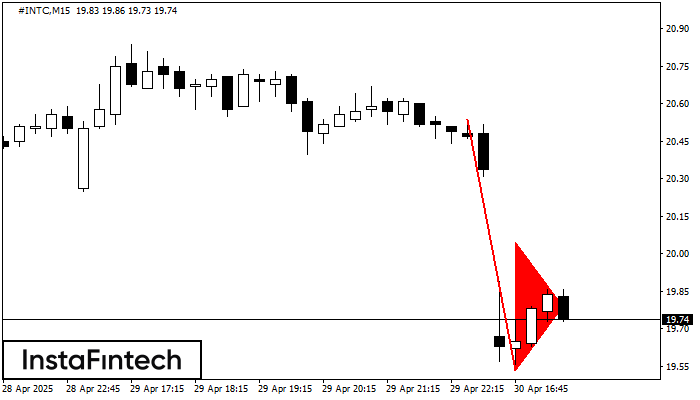
O padrão Pennant de baixa foi formado no gráfico #INTC M15. O padrão sinaliza a continuação da tendência de baixa caso o pennant de baixa de 19.53 for quebrada. Recomendações
Os intervalos M5 e M15 podem ter mais pontos de entrada falsos.
Open chart in a new window
Retângulo de baixa
was formed on 30.04 at 16:31:32 (UTC+0)
signal strength 3 of 5
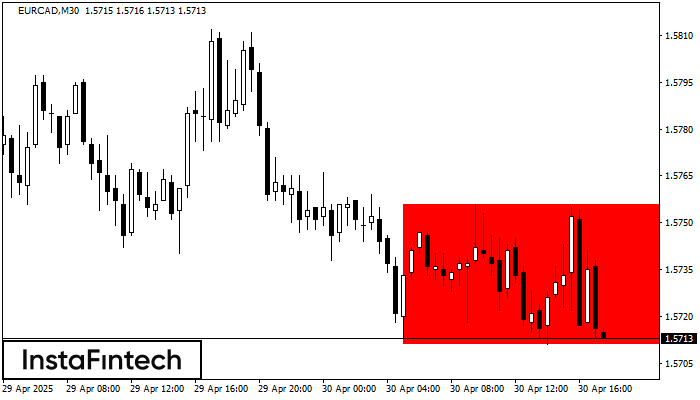
De acordo com o gráfico de M30, EURCAD formou Retângulo de baixa que é um padrão de uma continuação de tendência. O padrão está dentro dos seguintes limites: limite inferior
Open chart in a new window