Padrões atuais

Padrões são modelos gráficos que são formados no gráfico pelo preço. Segundo um dos postulados da análise técnica, a história (movimento de preços) se repete. Isso significa que os movimentos de preços geralmente são semelhantes nas mesmas situações, o que possibilita prever o desenvolvimento futuro da situação com alta probabilidade.
Os padrões relevantes da InstaTrade são um serviço fácil de usar, que permite que você esteja ciente das últimas mudanças no mercado e reaja a indícios do mercado a tempo. Em nosso serviço, você sempre encontrará os padrões mais recentes e relevantes em qualquer par e em qualquer período gráfico.
Double Bottom
was formed on 08.04 at 20:35:33 (UTC+0)
signal strength 1 of 5
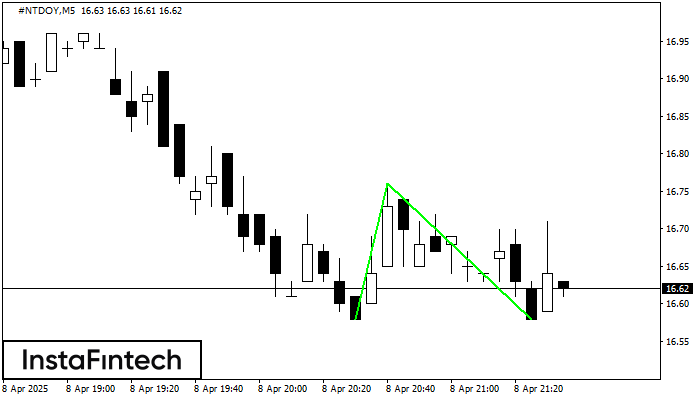
The Double Bottom pattern has been formed on #NTDOY M5. This formation signals a reversal of the trend from downwards to upwards. The signal is that a buy trade should be opened after the upper boundary of the pattern 16.76 is broken. The further movements will rely on the width of the current pattern 18 points.
The M5 and M15 time frames may have more false entry points.
Veja também
- All
- All
- Bearish Rectangle
- Bearish Symmetrical Triangle
- Bearish Symmetrical Triangle
- Bullish Rectangle
- Double Top
- Double Top
- Triple Bottom
- Triple Bottom
- Triple Top
- Triple Top
- All
- All
- Buy
- Sale
- All
- 1
- 2
- 3
- 4
- 5
Topo duplo
was formed on 30.04 at 17:55:22 (UTC+0)
signal strength 1 of 5
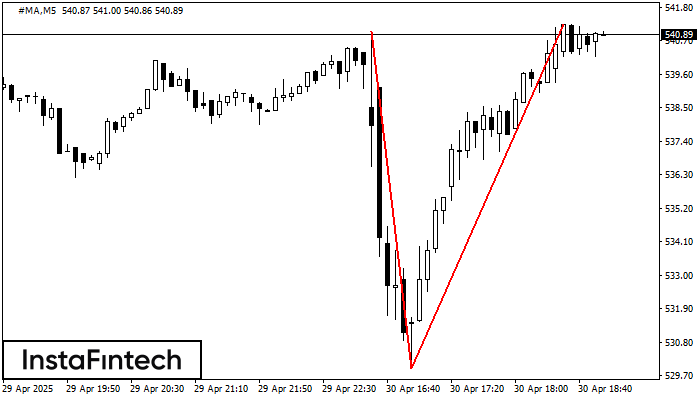
No gráfico de #MA M5 o padrão de reversão Topo duplo foi formado. Características: o limite superior 541.24; o limite inferior 529.93; a largura do padrão 1131 pontos. O sinal
Os intervalos M5 e M15 podem ter mais pontos de entrada falsos.
Open chart in a new window
Pennant de baixa
was formed on 30.04 at 16:35:46 (UTC+0)
signal strength 2 of 5
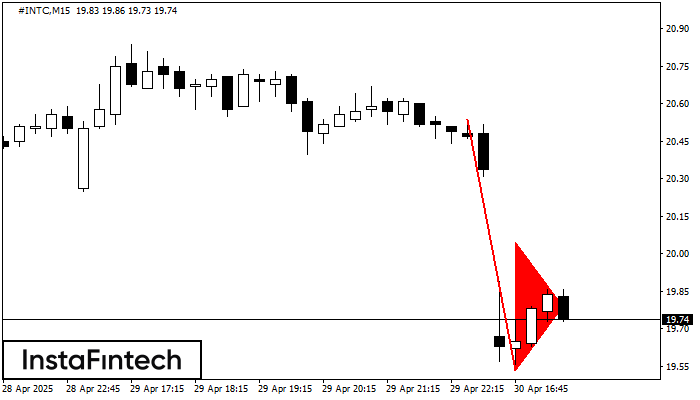
O padrão Pennant de baixa foi formado no gráfico #INTC M15. O padrão sinaliza a continuação da tendência de baixa caso o pennant de baixa de 19.53 for quebrada. Recomendações
Os intervalos M5 e M15 podem ter mais pontos de entrada falsos.
Open chart in a new window
Retângulo de baixa
was formed on 30.04 at 16:31:32 (UTC+0)
signal strength 3 of 5
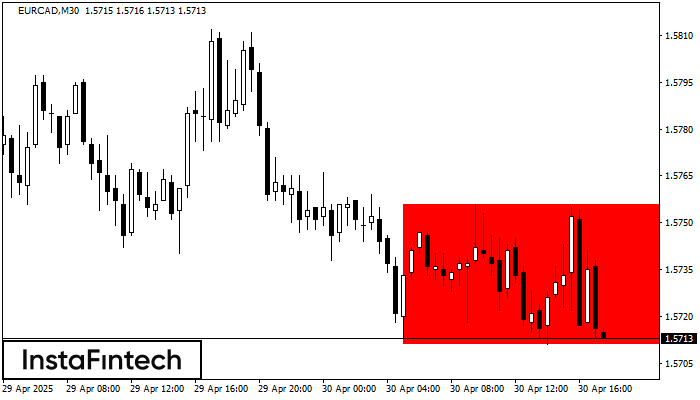
De acordo com o gráfico de M30, EURCAD formou Retângulo de baixa que é um padrão de uma continuação de tendência. O padrão está dentro dos seguintes limites: limite inferior
Open chart in a new window