#AMZN (Amazon.com, Inc.). Exchange rate and online charts.
Currency converter
10 Jan 2025 22:59
(-0.15%)
Closing price, the previous day.
Opening price.
The highest price over the last trading day.
The lowest price over the last trading day
Price range high in the last week
Price range low in the last week
AMZN is the shares of the American company Amazon.com Inc. Amazon.com has become one of the largest companies by turnover among those that sell commodities and services online. Besides, it is the first internet service oriented towards sales of mass-market actuals. The Amazon headquarters is located in Seattle, Washington.
The company was founded in 1994; in a year, its main site was launched. Originally, Amazon.com was focused only on selling books, however, at present time, the service takes in 34 types of goods including e-books, household appliances and electronics, toys, food, housewares, etc. The company works in two segments – the United States and international level. Amazon branches are situated not only in USA but also beyond them, for example, in Brazil, Canada, UK, Germany, Japan, France, Italy, India and China.
The company managed to use successfully two main advantages of internet trading - opportunity to address to the largest number of potential customers and availability of vast number of goods irrespectively of their physical presence in a storehouse.
According to the results of the fourth quarter of 2013, the company's earnings were $0.51 per share, which is much more than $0.21 logged in the previous year. However, analysts say that profits are going to grow further, though, at a slower pace. The total earnings for the same period made up $25.59 billion which is more than the figures of 2012 by more than 20%.
See Also
- Technical analysis of EUR/USD, USD/JPY, USDX and Bitcoin.
Author: Sebastian Seliga
12:24 2025-01-10 UTC+2
5308
Potential for the further rally in CrudeAuthor: Petar Jacimovic
11:55 2025-01-10 UTC+2
5293
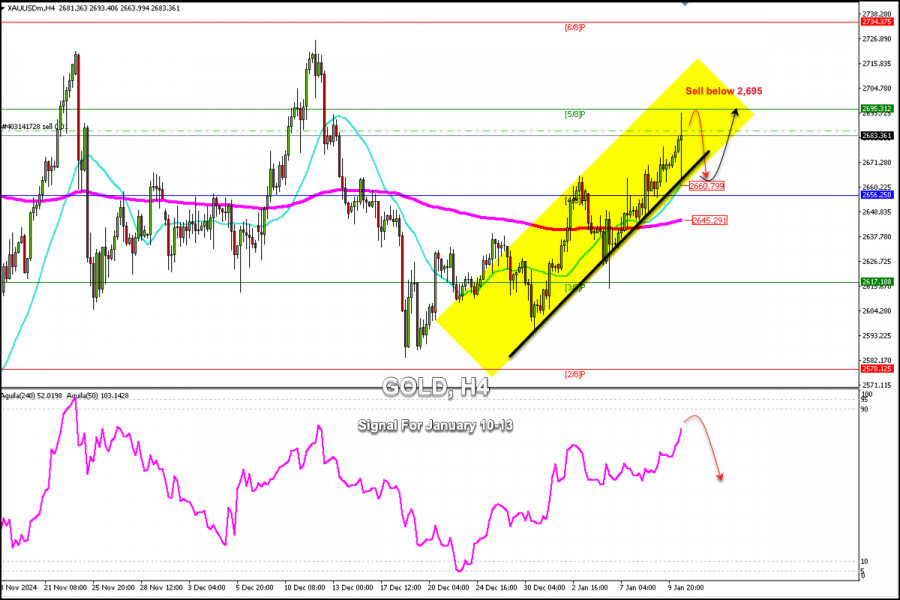
Technical analysisTrading Signals for GOLD (XAU/USD) for January 10-13, 2025: sell below $2,695 (21 SMA - 5/8 Murray)
On the H1 chart, gold is reaching overbought levels. So, we will look for opportunities to sell in the next few hours, with targets at 2,675 and 2,665.Author: Dimitrios Zappas
17:02 2025-01-10 UTC+2
2368
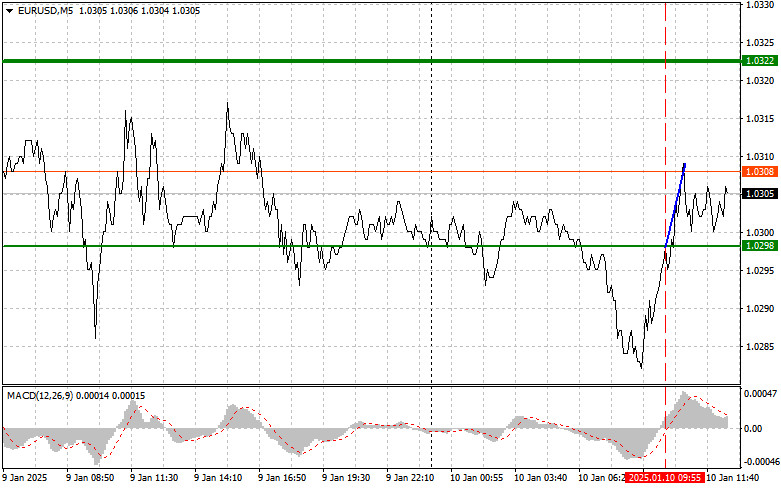
- A test of the 1.0298 level coincided with the MACD indicator beginning to move upward from the zero mark
Author: Jakub Novak
13:08 2025-01-10 UTC+2
2113
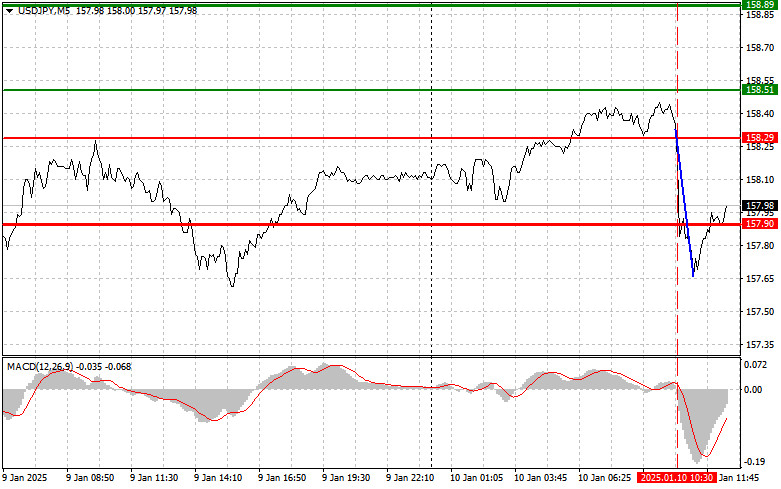
A test of the 158.29 level occurred when the MACD indicator was just beginning to move downward from the zero markAuthor: Jakub Novak
13:13 2025-01-10 UTC+2
1993
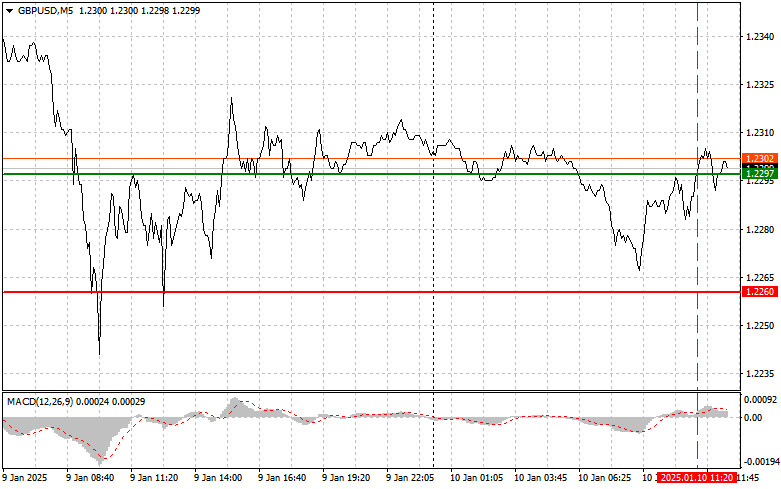
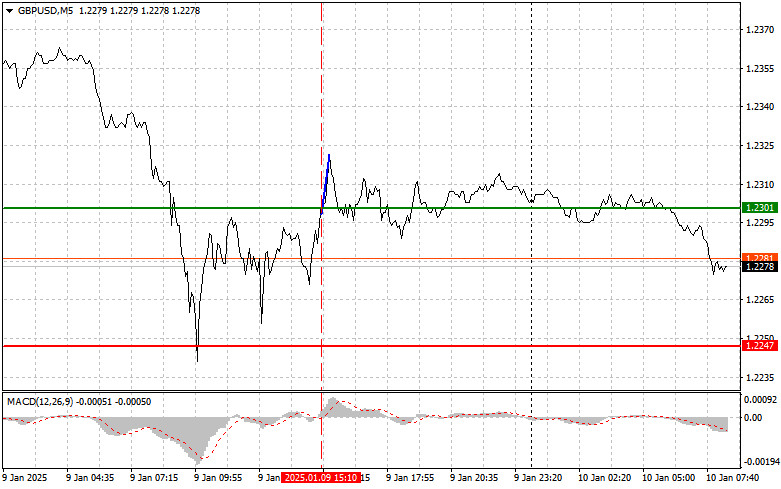
A test of the 1.2297 level during the first half of the day occurred when the MACD indicator had already moved significantly above the zero markAuthor: Jakub Novak
13:11 2025-01-10 UTC+2
1813
- Type of analysis
GBP/USD: Simple Trading Tips for Beginner Traders on January 10. Analysis of Yesterday's Forex Trades
GBP/USD: Simple Trading Tips for Beginner Traders on January 10. Analysis of Yesterday's Forex TradesAuthor: Jakub Novak
09:13 2025-01-10 UTC+2
1813
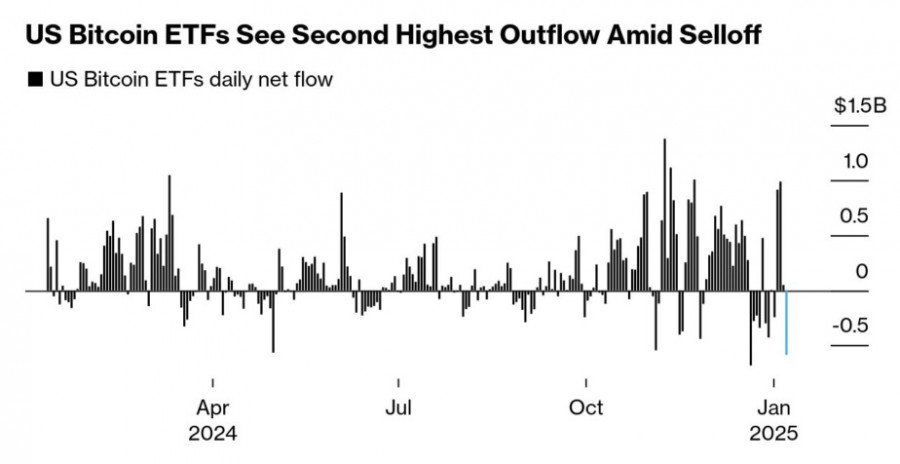
The uptrend in BTC/USD risks shifting into a correctionAuthor: Marek Petkovich
09:58 2025-01-10 UTC+2
1813
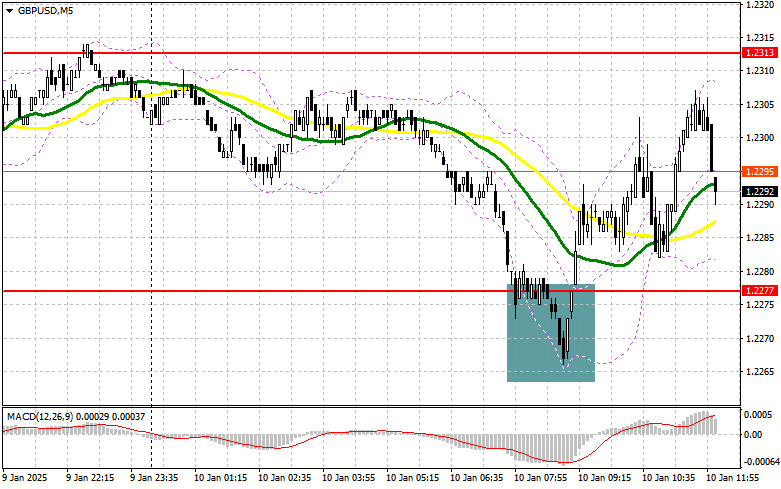
Trading planGBP/USD: Trading Plan for the U.S. Session on January 10th (Analysis of Morning Trades)
In my morning forecast, I highlighted the 1.2277 level and planned to make trading decisions based on itAuthor: Miroslaw Bawulski
13:06 2025-01-10 UTC+2
1783
- Technical analysis of EUR/USD, USD/JPY, USDX and Bitcoin.
Author: Sebastian Seliga
12:24 2025-01-10 UTC+2
5308
- Potential for the further rally in Crude
Author: Petar Jacimovic
11:55 2025-01-10 UTC+2
5293
- Technical analysis
Trading Signals for GOLD (XAU/USD) for January 10-13, 2025: sell below $2,695 (21 SMA - 5/8 Murray)
On the H1 chart, gold is reaching overbought levels. So, we will look for opportunities to sell in the next few hours, with targets at 2,675 and 2,665.Author: Dimitrios Zappas
17:02 2025-01-10 UTC+2
2368
- A test of the 1.0298 level coincided with the MACD indicator beginning to move upward from the zero mark
Author: Jakub Novak
13:08 2025-01-10 UTC+2
2113
- A test of the 158.29 level occurred when the MACD indicator was just beginning to move downward from the zero mark
Author: Jakub Novak
13:13 2025-01-10 UTC+2
1993
- A test of the 1.2297 level during the first half of the day occurred when the MACD indicator had already moved significantly above the zero mark
Author: Jakub Novak
13:11 2025-01-10 UTC+2
1813
- Type of analysis
GBP/USD: Simple Trading Tips for Beginner Traders on January 10. Analysis of Yesterday's Forex Trades
GBP/USD: Simple Trading Tips for Beginner Traders on January 10. Analysis of Yesterday's Forex TradesAuthor: Jakub Novak
09:13 2025-01-10 UTC+2
1813
- The uptrend in BTC/USD risks shifting into a correction
Author: Marek Petkovich
09:58 2025-01-10 UTC+2
1813
- Trading plan
GBP/USD: Trading Plan for the U.S. Session on January 10th (Analysis of Morning Trades)
In my morning forecast, I highlighted the 1.2277 level and planned to make trading decisions based on itAuthor: Miroslaw Bawulski
13:06 2025-01-10 UTC+2
1783


