Vea también


 07.04.2025 06:57 AM
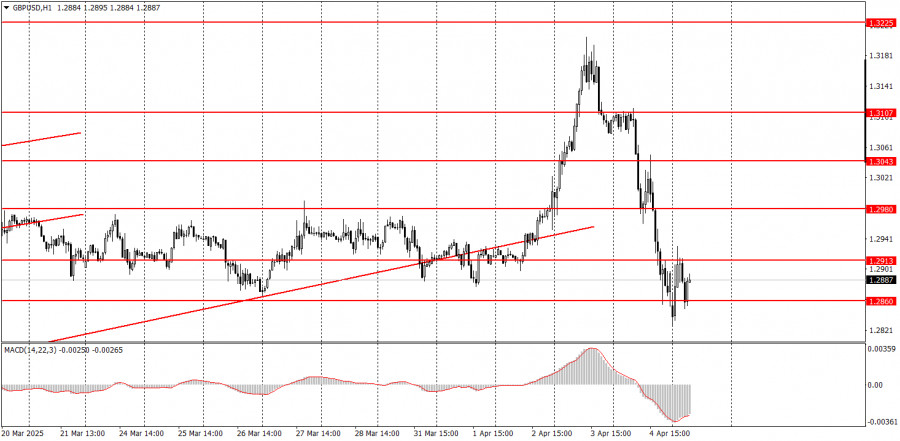
The GBP/USD pair showed a sharp decline on Friday, which is extremely difficult to explain—even in hindsight. Yes, the British pound is overbought and unjustifiably expensive. The only reason for its growth in recent months has been Donald Trump. The market openly ignored all other news, events, and reports. What caused the U.S. dollar to gain 300 pips on Friday? The NonFarm Payrolls report showed a strong figure, but the U.S. unemployment report turned out worse than forecast. Jerome Powell took a hawkish stance, but his speech occurred in the evening, while the dollar began strengthening in the early morning. All in all, chaos continues to dominate the market.
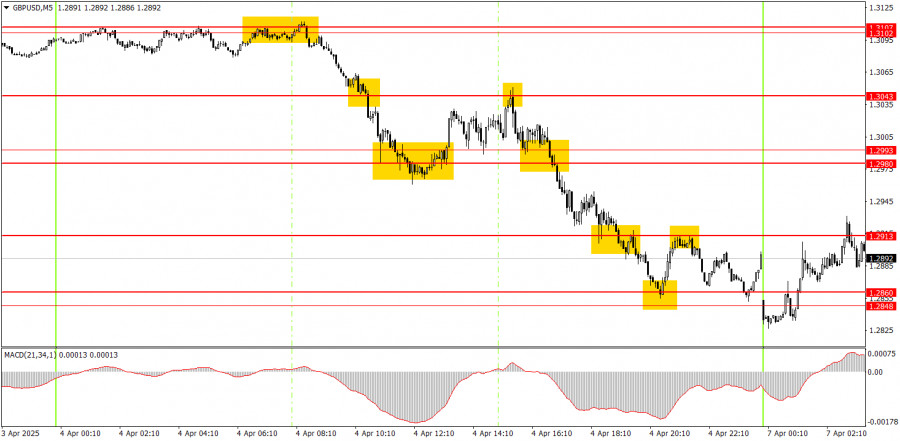
On Friday, many trading signals were generated in the 5-minute timeframe. Most of them were indeed tradable—the pound moved more technically than the euro. However, the movements were very strong. The pound could have been sold as early as the start of the European session after a bounce from the 1.3102–1.3107 area. Later, the pair dropped to the 1.2980–1.2993 zone and formed a buy signal. From the 1.3043 level, it was again possible to sell down to 1.2860.
On the hourly timeframe, the GBP/USD pair should have started a downward trend long ago, but Trump keeps doing everything to push the dollar even lower. Since the official start of the global trade war, we can't even attempt to predict how currency pairs will move in the long term. On Friday, we saw a substantial decline, which could mark the beginning of a significant correction. However, the market remains at the mercy of Trump and his decisions. We may soon witness another collapse of the U.S. dollar if the trade war continues to escalate.
The GBP/USD pair may remain in turmoil on Monday. Predicting the direction of the pound or the dollar today is virtually impossible. The movements are very strong and chaotic. The only option is to trade based on the levels in the 5-minute timeframe.
On the 5-minute chart, trading can currently be done using the following levels: 1.2502–1.2508, 1.2547, 1.2613, 1.2680–1.2685, 1.2723, 1.2791–1.2798, 1.2848–1.2860, 1.2913, 1.2980–1.2993, 1.3043, 1.3102–1.3107, 1.3145–1.3167, 1.3225, 1.3272. No significant events or reports are scheduled for Monday in the UK or the U.S. However, volatility may still be very high today, and the movements may remain erratic.
Support and Resistance Levels: These are target levels for opening or closing positions and can also serve as points for placing Take Profit orders.
Red Lines: Channels or trendlines indicating the current trend and the preferred direction for trading.
MACD Indicator (14,22,3): A histogram and signal line used as a supplementary source of trading signals.
Important Events and Reports: Found in the economic calendar, these can heavily influence price movements. Exercise caution or exit the market during their release to avoid sharp reversals.
Forex trading beginners should remember that not every trade will be profitable. Developing a clear strategy and practicing proper money management are essential for long-term trading success.
You have already liked this post today
*El análisis de mercado publicado aquí tiene la finalidad de incrementar su conocimiento, más no darle instrucciones para realizar una operación.
GBP/USD: plan para la sesión europea del 22 de abril. Informes Commitment of Traders (COT) (análisis de las operaciones de ayer). La libra no pierde la esperanza de un nuevo
Ayer se formaron varios puntos de entrada al mercado. Veamos el gráfico de 5 minutos y analicemos qué sucedió. En mi pronóstico de la mañana presté atención al nivel
Ayer no se formaron puntos de entrada normales al mercado. Veamos el gráfico de 5 minutos y analicemos lo que ocurrió. En mi pronóstico matutino llamé la atención sobre
Ayer se formaron varios puntos de entrada al mercado. Veamos el gráfico de 5 minutos y analicemos lo que sucedió. En mi pronóstico matutino llamé la atención sobre el nivel
Ayer no se formaron puntos de entrada normales al mercado. Veamos el gráfico de 5 minutos y analicemos lo que ocurrió. En mi pronóstico matutino presté atención al nivel
Ayer se formaron varios puntos de entrada al mercado. Veamos el gráfico de 5 minutos y analicemos lo que ocurrió. En mi pronóstico matutino presté atención al nivel de 1.1341
Ayer no se formaron puntos normales de entrada al mercado. Veamos el gráfico de 5 minutos y analicemos lo que sucedió. En mi pronóstico matutino presté atención al nivel
Ayer se formaron varios puntos de entrada al mercado. Veamos el gráfico de 5 minutos y analicemos lo que sucedió. En mi pronóstico matutino presté atención al nivel de 1.1377
Ayer se formaron varios puntos de entrada al mercado. Veamos el gráfico de 5 minutos y analicemos lo que ocurrió. En mi pronóstico matutino presté atención al nivel de 1.2842
Ayer se formaron varios puntos de entrada al mercado. Veamos el gráfico de 5 minutos y analicemos lo que ocurrió. En mi pronóstico matutino presté atención al nivel de 1.1086
Notificaciones
por correo electrónico y mensaje de texto

Your IP address shows that you are currently located in the USA. If you are a resident of the United States, you are prohibited from using the services of InstaFintech Group including online trading, online transfers, deposit/withdrawal of funds, etc.
If you think you are seeing this message by mistake and your location is not the US, kindly proceed to the website. Otherwise, you must leave the website in order to comply with government restrictions.
Why does your IP address show your location as the USA?
Please confirm whether you are a US resident or not by clicking the relevant button below. If you choose the wrong option, being a US resident, you will not be able to open an account with InstaTrade anyway.
We are sorry for any inconvenience caused by this message.


